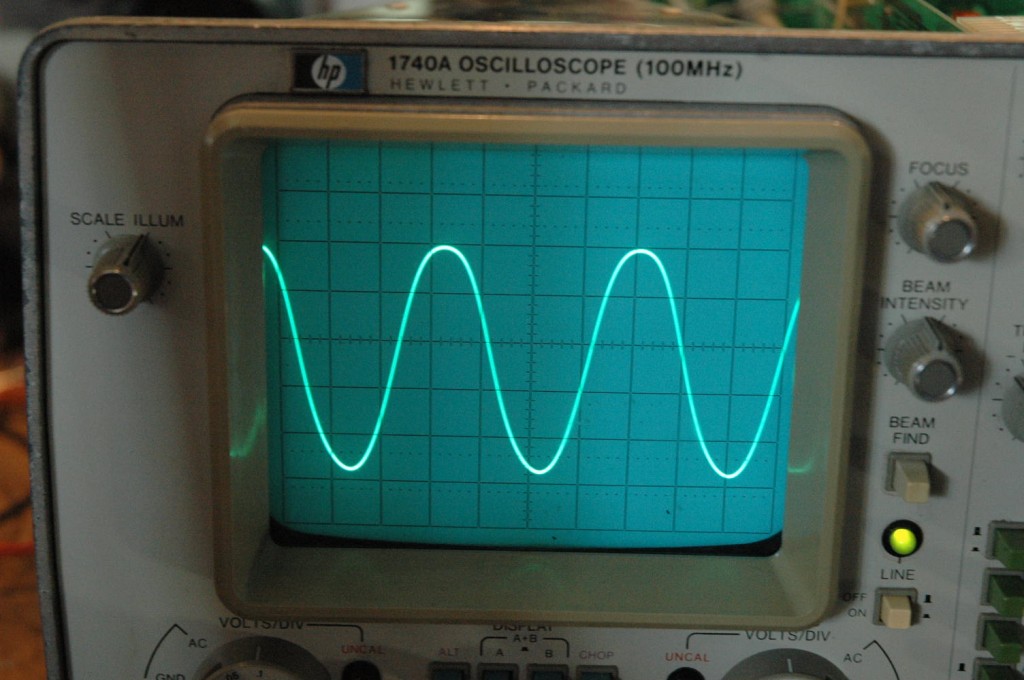
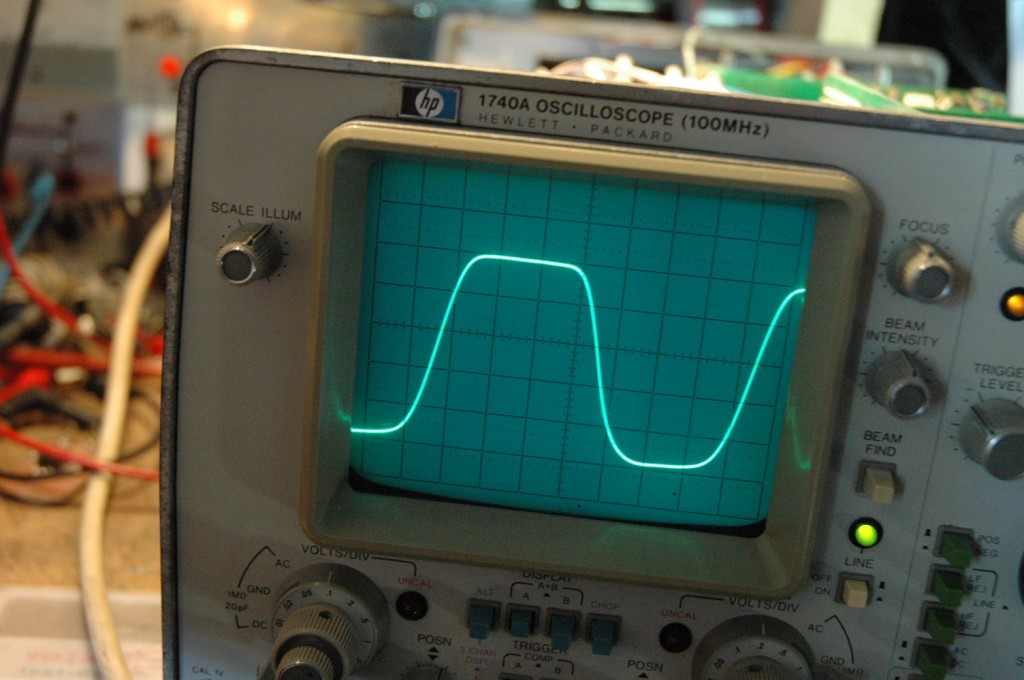
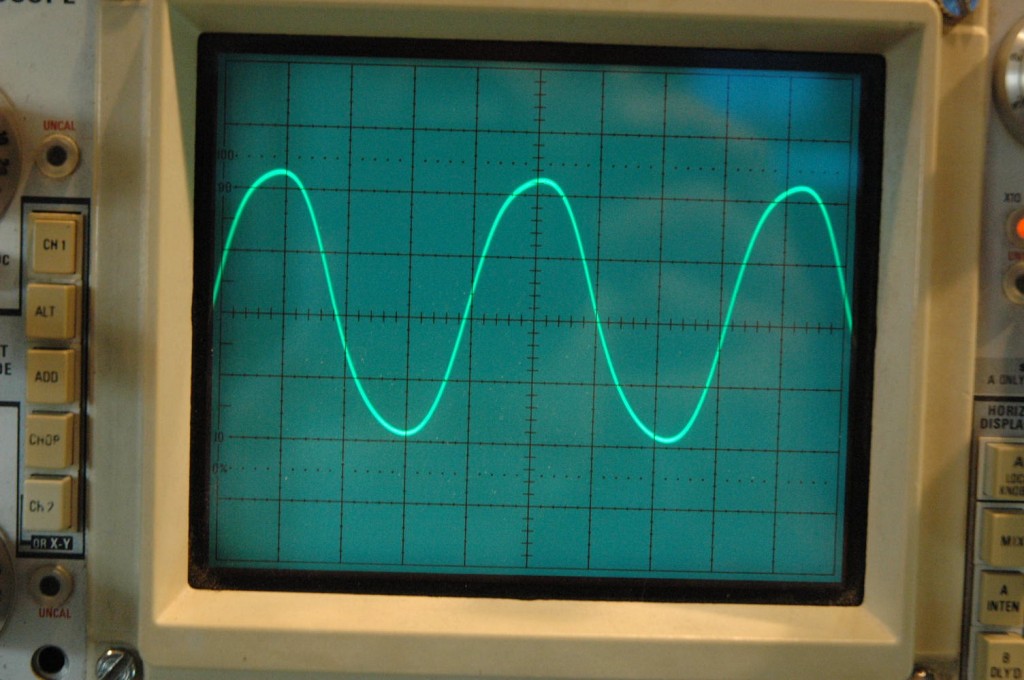
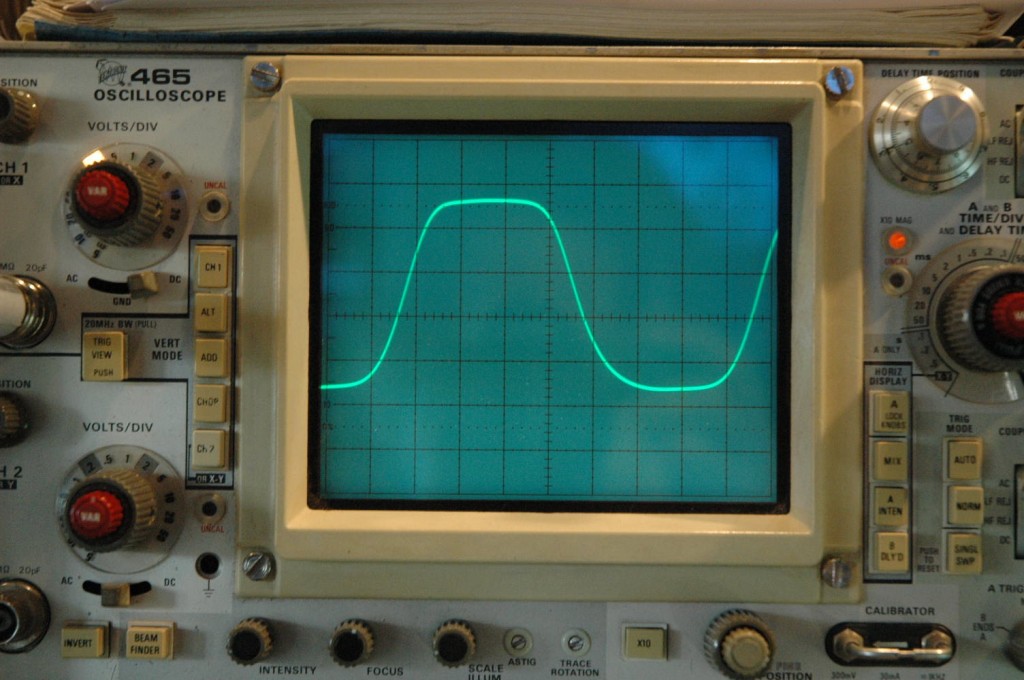
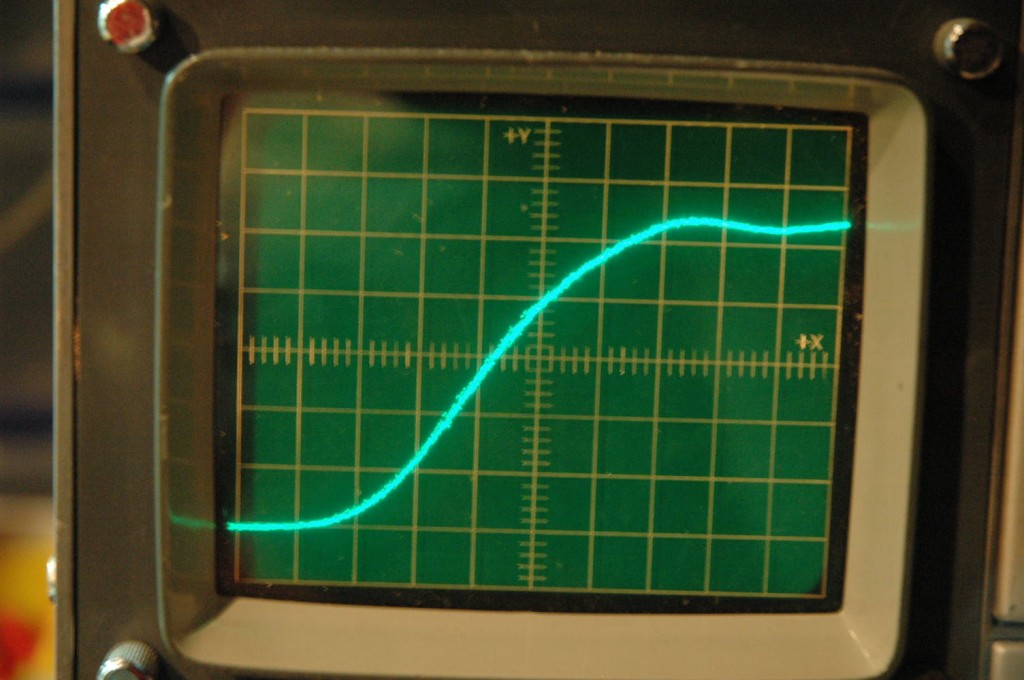
A scope has a defined bandwidth. If you have a 100Mhz scope this means the amplitude from your signal is down 3dB at 100MHz. This does not seem much but it is 0,707 times the real value. 6dB is only half the real amplitude. What happens after the 3dB point is not described. Not every scope falls down the same slope. Besides that he must be able to trigger. Most times we just want to see of something is oscillating and a 100MHz scope will show you still some signal at 200MHz. A 20MHz scope gives up around 40MHz so this is the advantage of a faster scope. But the amplitude is not calibrated anymore at that point and details dissapear.
A periodic signal is according to Fourier build from sinewaves. To show the trace of a square wave the right way you need a bandwidth that is about 10 times the frequency of the square wave. So a 100MHz scope can reproduce a 10MHz square. A higher frequency starts to look like a sinewave
So a waveform with a frequency above the bandwidth of your scope can be something totally different as shown on your CRT. There are more parameters that have an influence like the CRT itself, the ristetime of your Y-amplifier and the deflection factor, how much volt is needed for 1 cm of trace movement.
But sometimes a signal has a larger amplitude as seen on the scope. If there is a large overshoot caused by an inductive element (like you see at the ESR measurement article on my site) the scope gets this high amplitude and the Y amp jumps right at it rail. The risetime looks very fast but you are only looking at a part of the real signal. So you think you look at a very nice puls while in real live it’s a monster 8)
(thanks to Mike for the following explanation )
[quote]To see what I’m suggesting, imagine a perfectly Gaussian scope responding to steps of 1 volt and 2 volts respectively. On the same scale, the 2 volt step has double the initial slope in V/s, and it crosses the 0.9V (“90%”) line sooner; of course it eventually asymptotes to 2V, not 1V.
You will set the scale on the scope under test according to the late-time asymptote of the observed waveform, which you assign to “100%”. But if the early portion of the rise is responding to a higher amplitude, this is not correct. The scope is not responding ‘faster’ than it otherwise could; it is effectively responding to a larger input energy than you calibrated looking at the asymptote.
It is possible to use sharp delta functions for this kind of characterization, but something like FWHM would be a better figure of merit, and you need another test to verify flat low-frequency response.
By contrast, the Heaviside contains all frequencies, including DC.
The asymptote is an additional constraint (basically a constant of integration). However one must be able assume a perfect step with no other transients.[/quote]
My first test is done with a sinewave generator. A HP8640. I first calibrated it using a HP selective voltage meter. The signal was -23,6dBm. I have used the 50 ohm input of the scope or if that was not there, I used a Hameg 50 ohm pass through terminator (good up to +2GHz)
A factor also important is the input capacitance . If that is 20pF , this will be 200 ohms paralleled to the 1 Mohm input. So an other reason the bandwidth is more limited in 1M mode and an other reason to use 50 Ohm while measuring fast signals. 150MHz and 12pF makes 88 ohms from your 1 Mohm input . When not working with 50 ohms terminated sources use a bandwidth matched 10:1 probe, high Z (low capacitance) probe or active probe. See my probetest page. http://www.pa4tim.nl/?p=3059
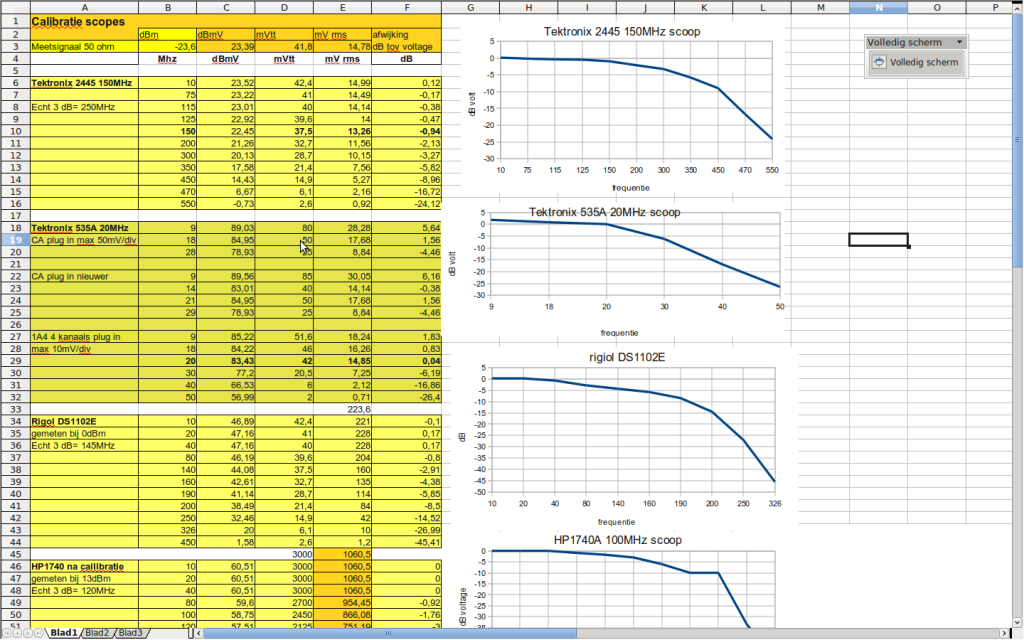
This are some measurement figures. This is old data, some scopes are gone or have been restored in the meanwhile, but it is just to illustrate how to document and calculate
Squarewaves as test
A second way is to use a square wave, like told above. A perfect square-wave only exists in ferry tales. You should have a ristetime of zero. This is not possible to make. A very, very fast pulser can make a 50pS risetime, most generators have risetimes in the nS range.
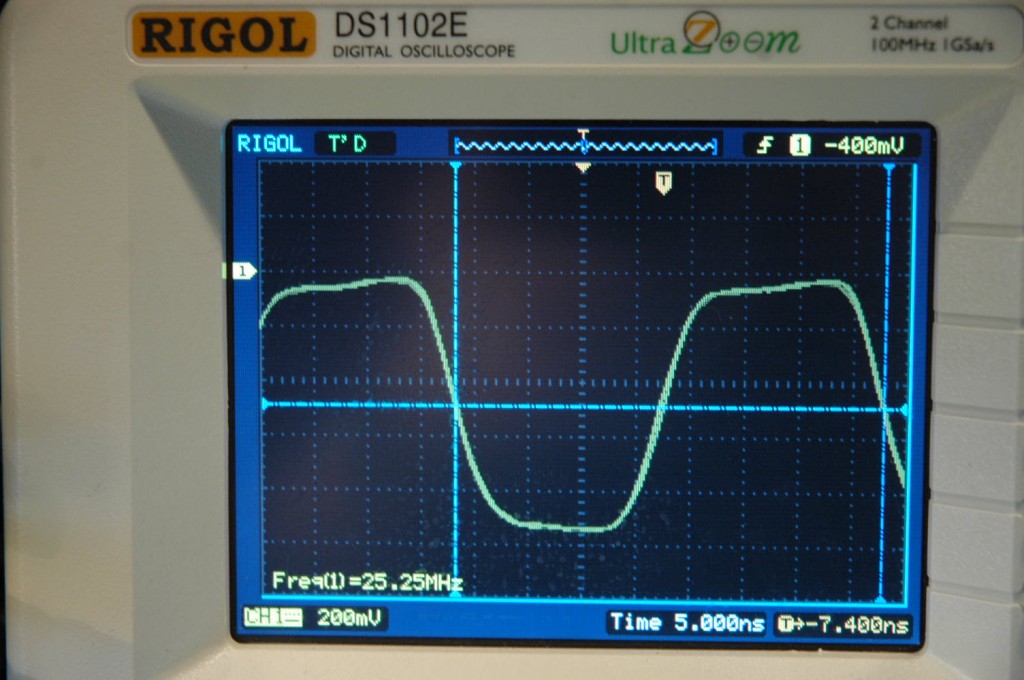
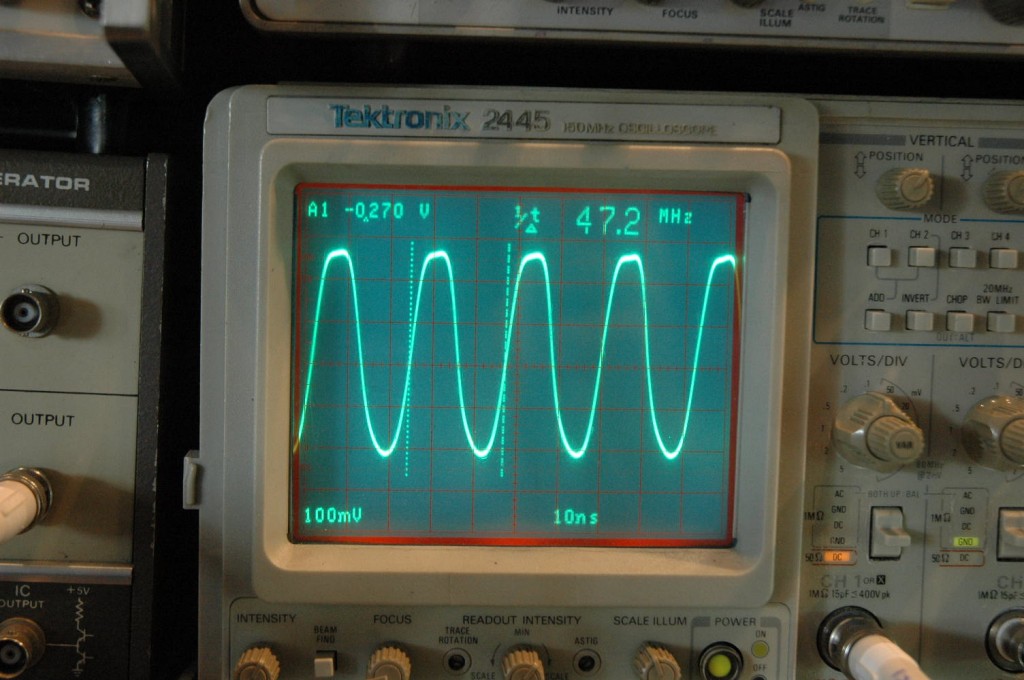
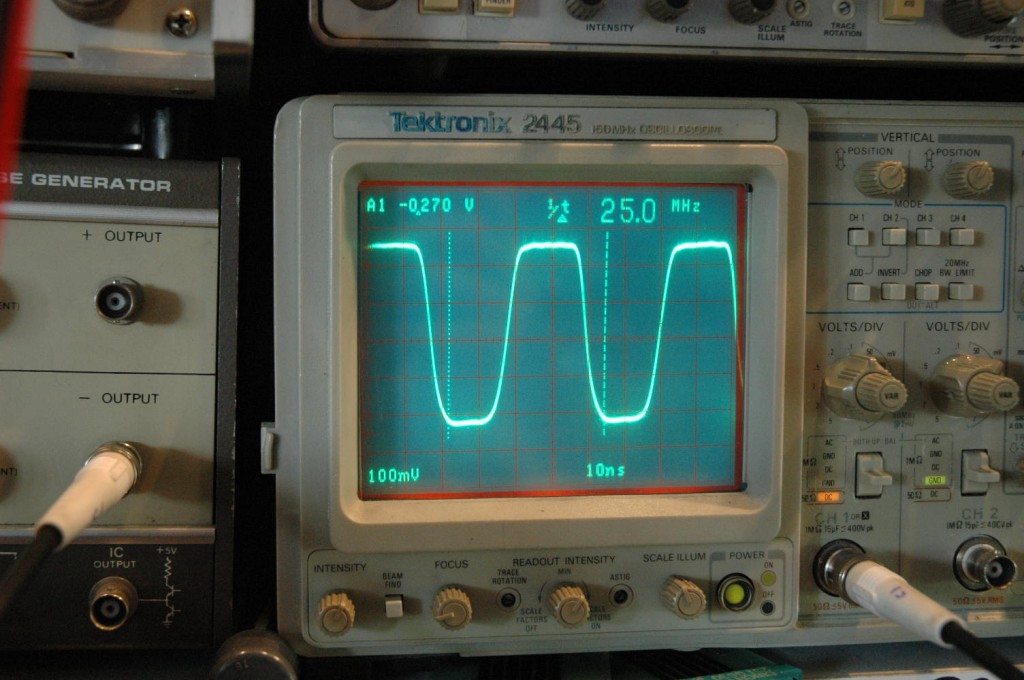
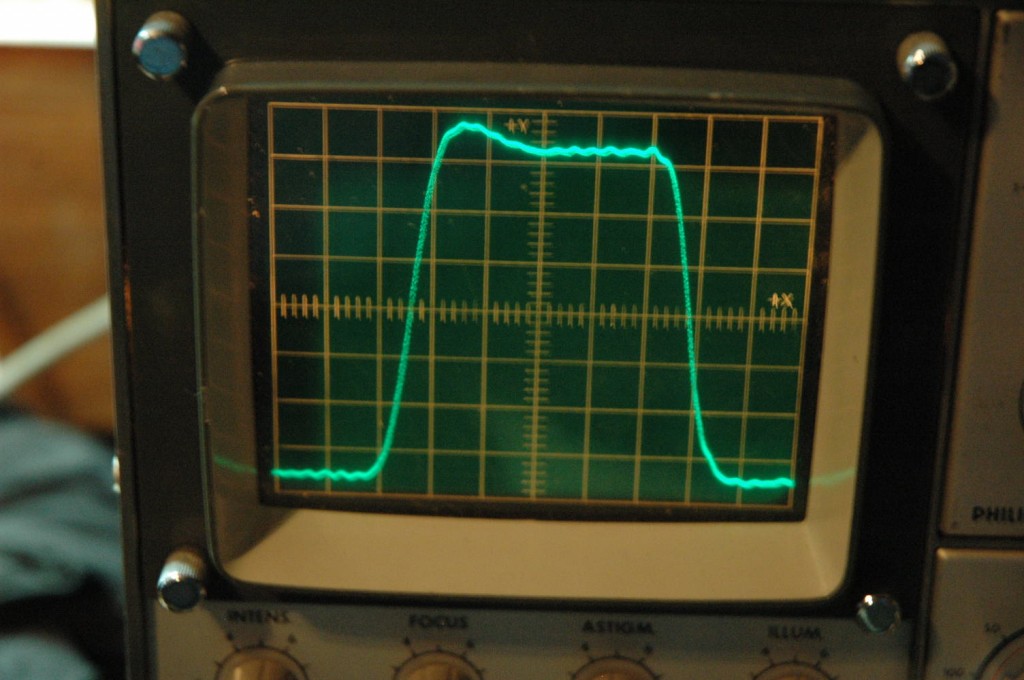
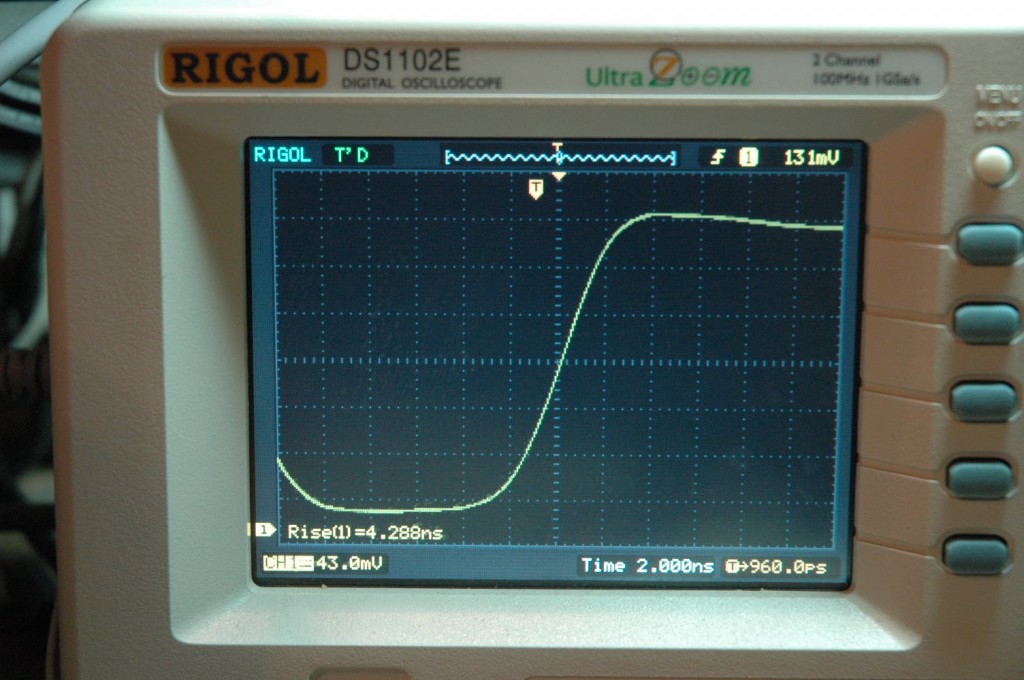
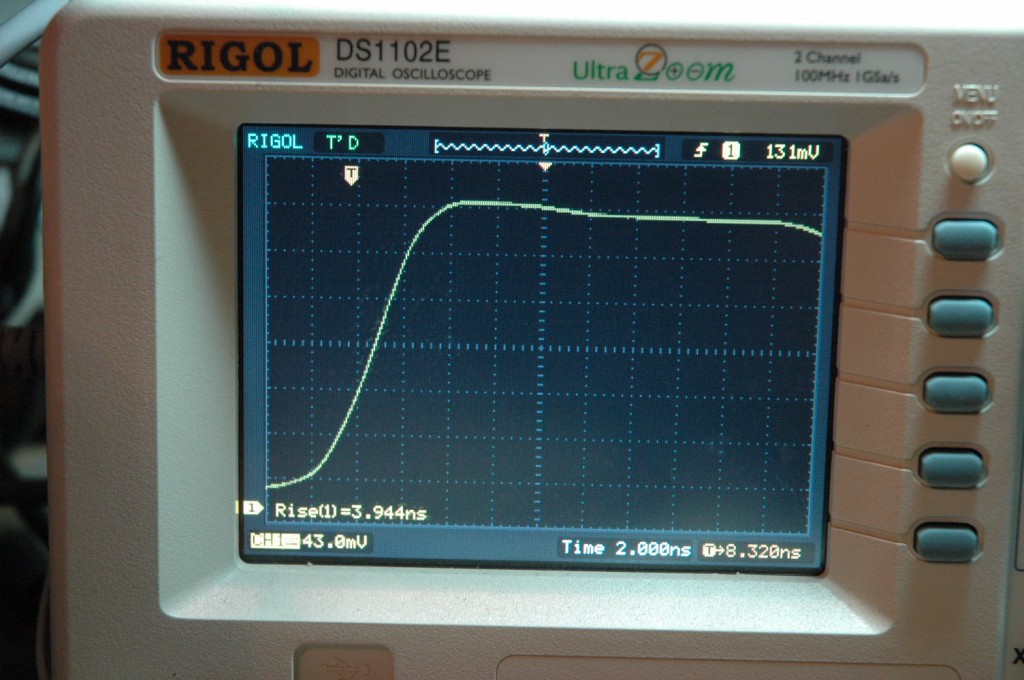
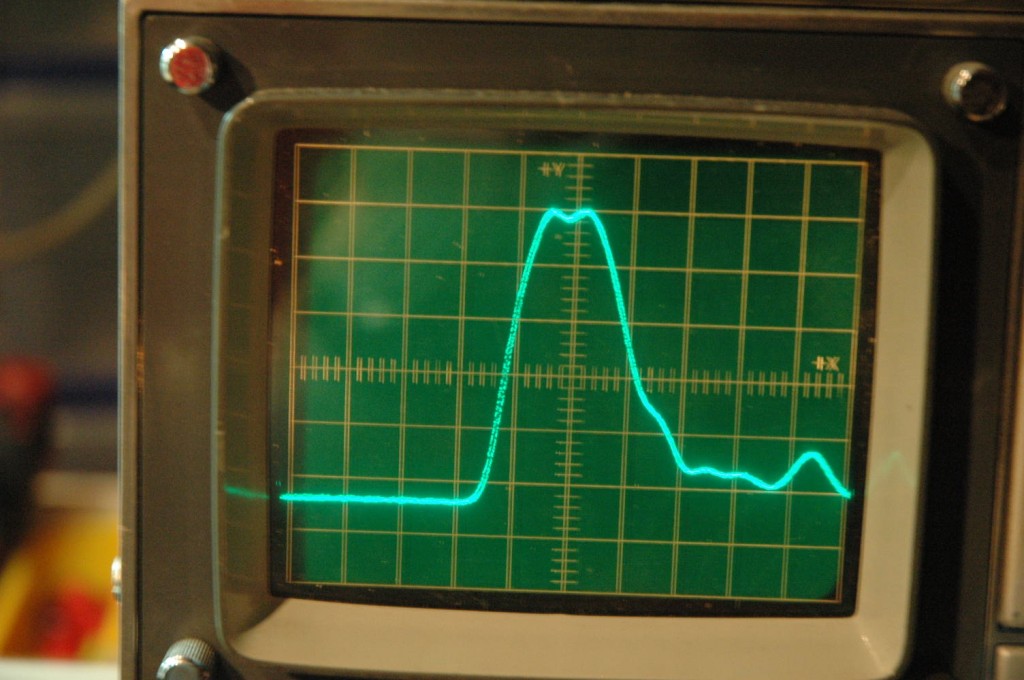
The squarewave on the pictures are from a 50 MHz pulsgenerator. There are two pictures from each scope. One showing a 25Mhz and the other at 50Mhz (I forgot to take the 50Mhz Rigol picture) Update jan 2013: at this moment I use a 90ps stepper and a 40Mhz 500ps squarewave generator for these tests.
Using a squarewave has a function. It is a way to look at bandwidth by measuring the 10-90% risetime. This is very difficult because you need a very fast pulse and a very fast scope to check if the pulse has no huge overshoot (like explained by Mike in the first part) I am lucky to have such a scope and my risetime measurements are in the same region as the first measurements with a sinewave.
This is how the test pulse should look. 2ns/div at a 1GHz scope.
For brickwall scopes BandWidth = 0.4/Tr (measured), for gaussian scopes it is 0.35/Tr. A good DSO is briockwall. The Rigol is all but brickwall so I give both values
81 Mhz gaussian and 93MHz brickwall.
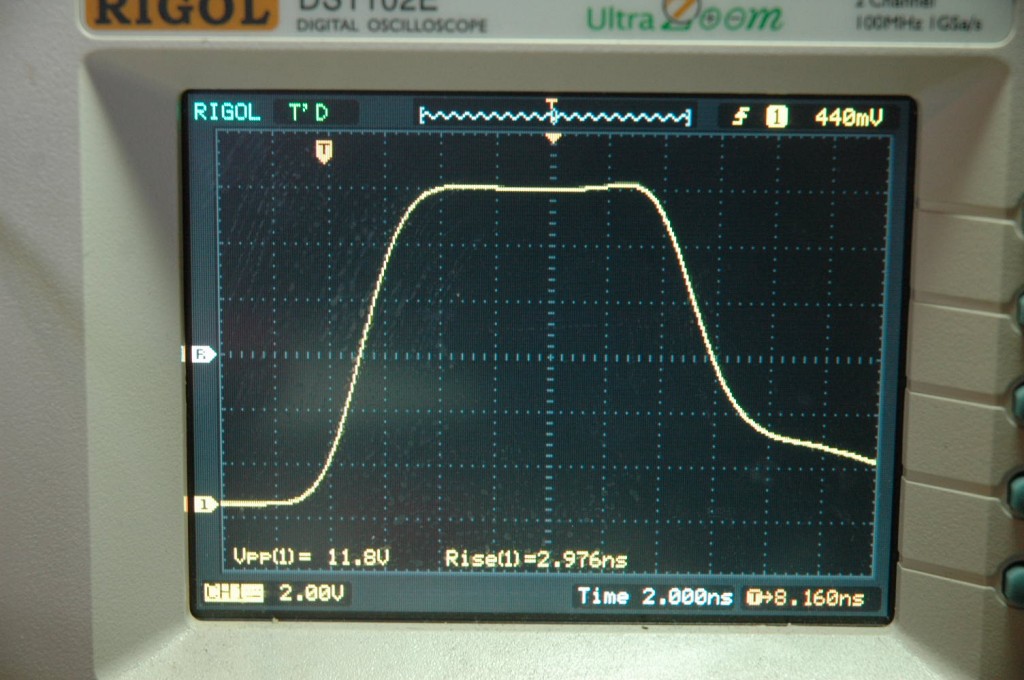
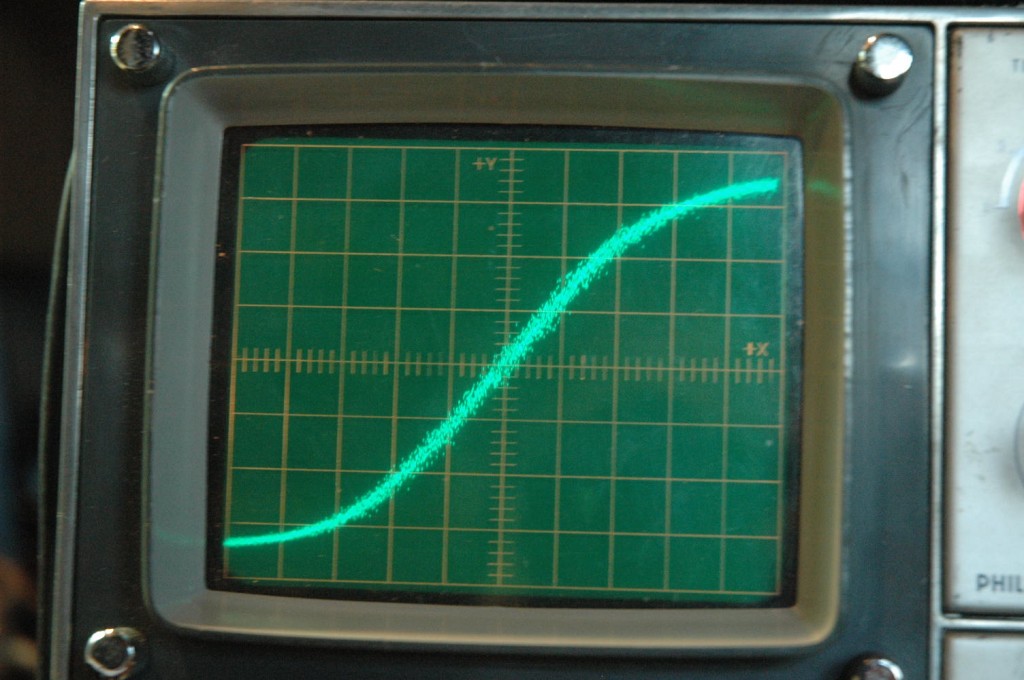
The rigol has nice digital functions but you see at this pictures it is not really something you can thrust. The risetime changes with the position on the screen.
Now it should be 101MHz is brickwalled.
______________
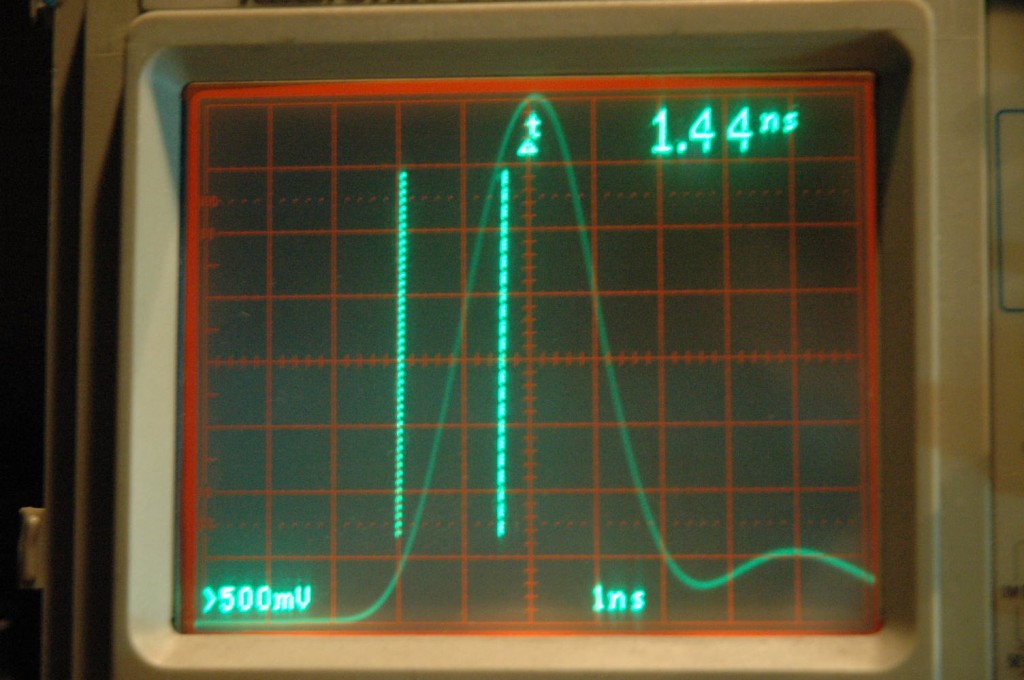
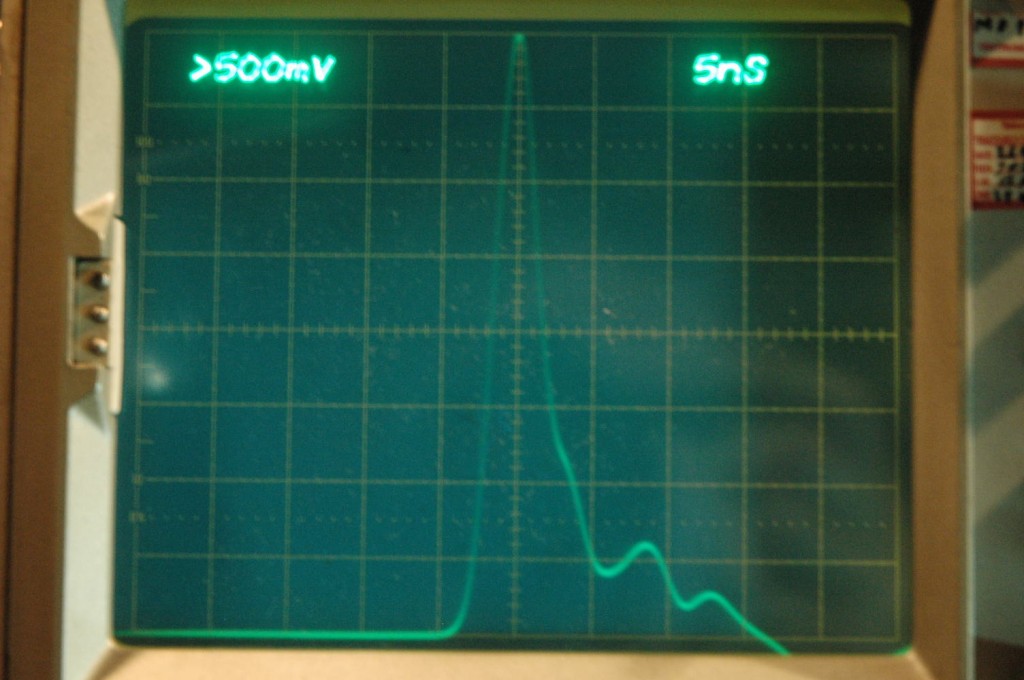
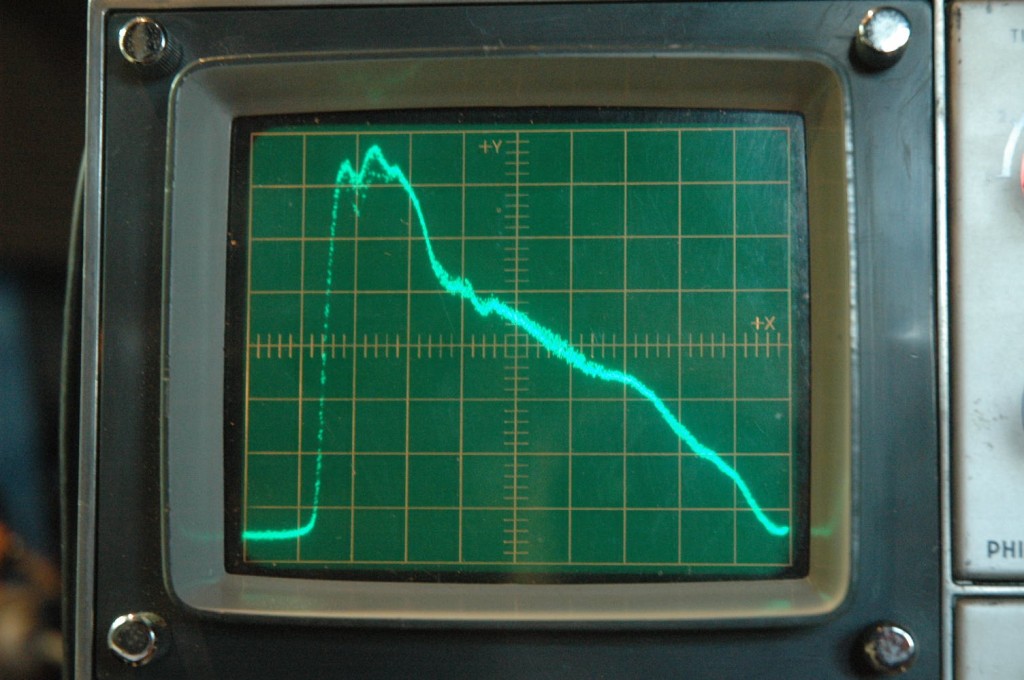
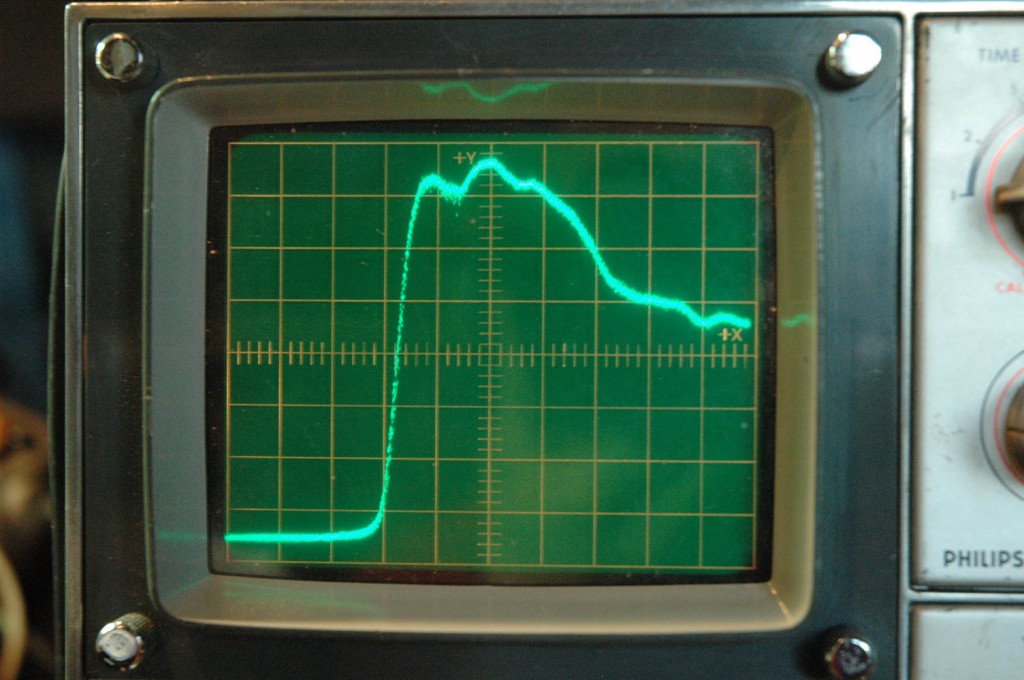
To make a better test (i was thinking at that time) I made a semi-dirac pulser. The pulsduration is about 2nS and the amplitude is 10.6Vpp. The risetime is 700pS.
This is an example of doing a test not the right way. The pulse duration is to short.
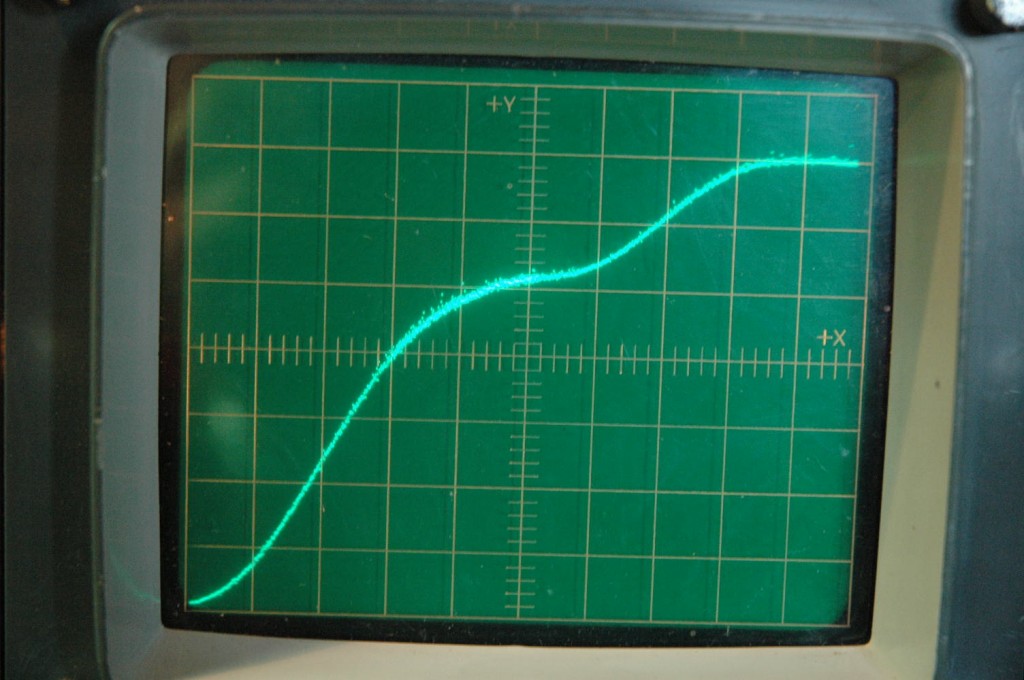
for the Philips no problem but the other scopes now show better but wrong results.
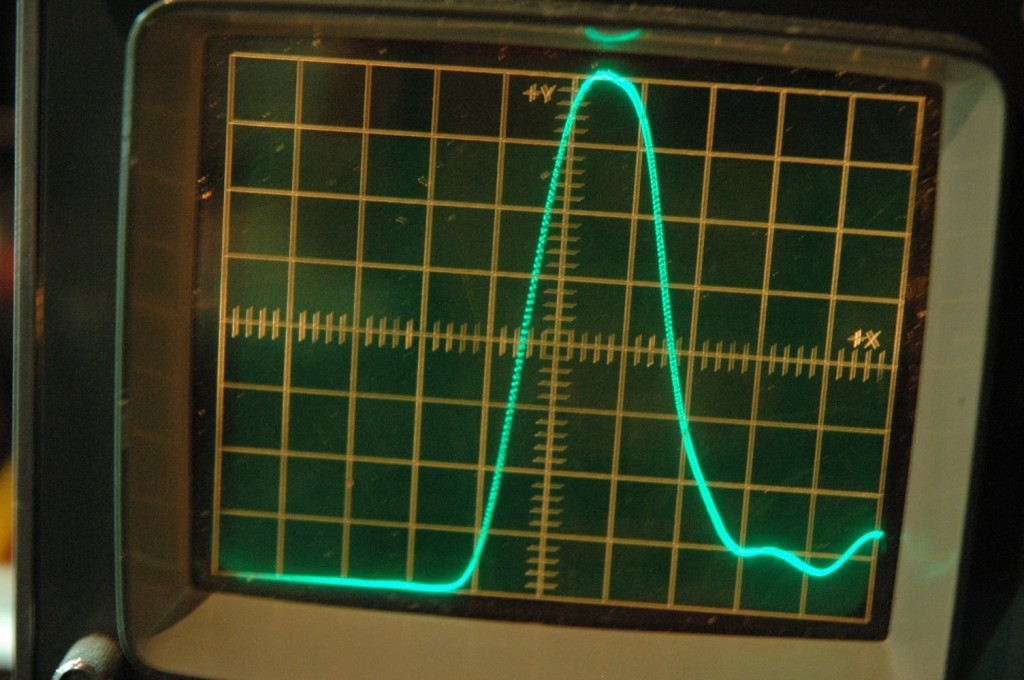
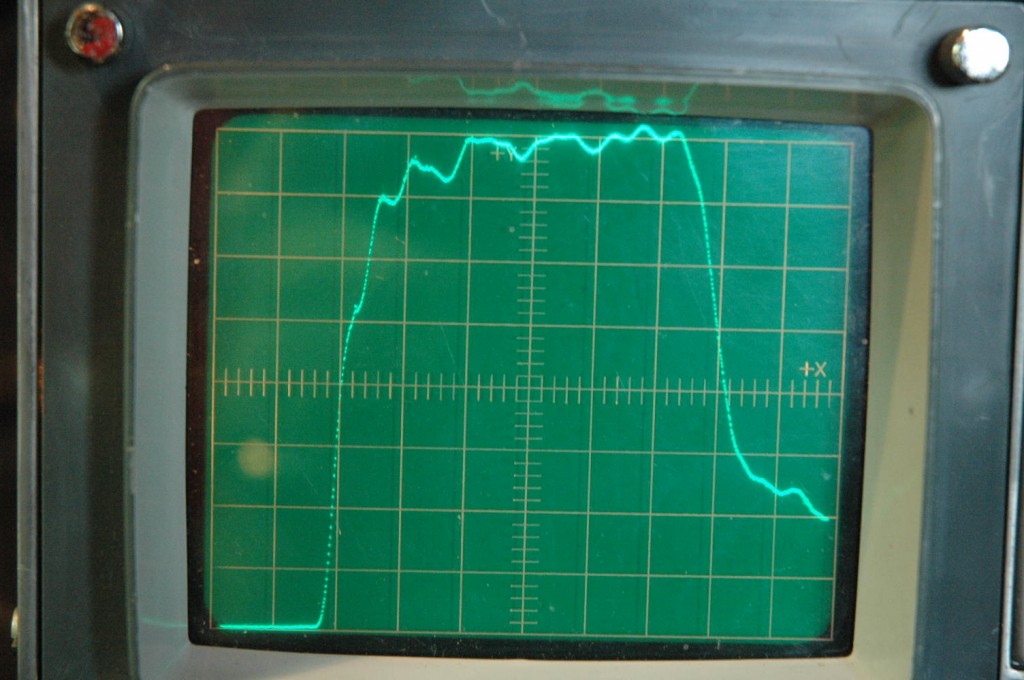
The tektronix 2445, a very fast 150Mhz scope. If we now calculate, the bandwidth should be 243 MHz. But in real we are only looking at a portion of the pulse. When the pulse is at its top the scope is only halfway. If we then take the 10-90% point on the screen this is not right because we only see a part ot the leading edge.
This Tek has a 200Mhz Y amplifier but only a 100Mhz screen and main Y amplifier so that is a bit difficult to judge. This scope has the best definition of the bump at the downgoing slope. Also here we can not measure bandwidth.
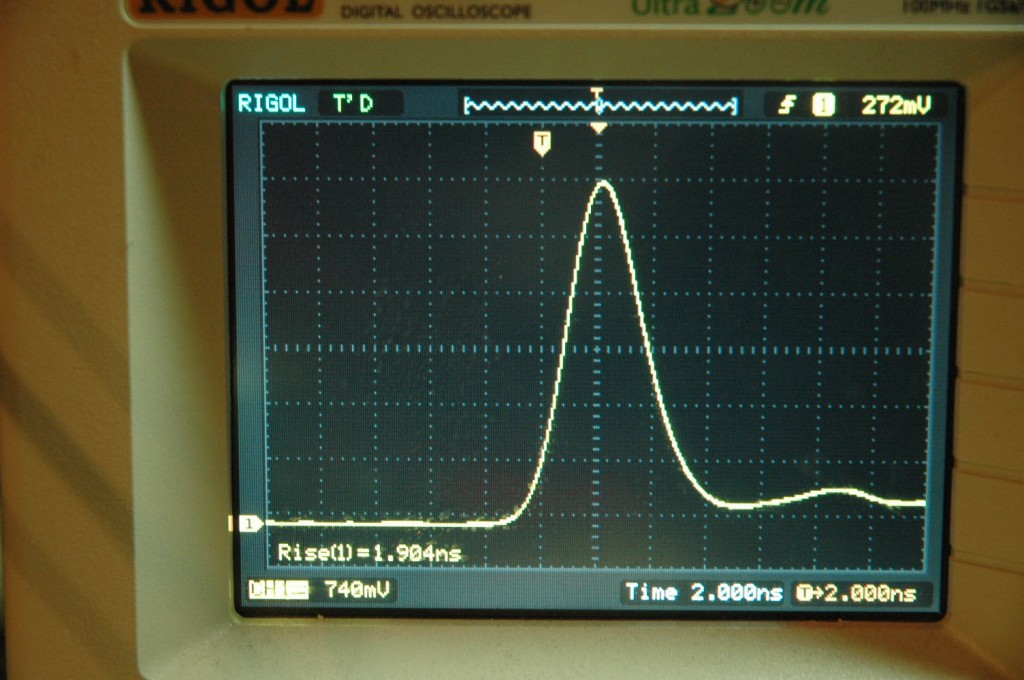
Hierboven zie je de Rigol 100MHz digitale scoop in average mode. Anders was de jitter te groot voor een foto. Met 1,9nS komt hij op 184MHz.
De amplitude is volgens Rigol maar 4,56Vtt
The Rigol is in average mode. It is 100Mhz. jitter is to big to make a picture without it. the 1.904 ns makes you think the BW is 184 MHz, we saw before it is maybe just 100MHz in real.
A scope is nothing without a good probe. You can test probes too. But for more tests see: http://www.pa4tim.nl/?p=3059
This is a picture from the Philips High Z active probe using a 20X attenuation probetip
_________________
I made a charge line on the collector of the first transistor. Just a meter or so RG58. Now the puls is about 12nS wide.
The first picture is 2nS/div
The V/div is not in calibrated position to better see risetime. The amplitude is 10.3Vtt in the highest top. But that is with a tektronix 100x attentuator with GR plugs made for a sampling scope. I have not checked the exact damping but with one removed the voltage was 10.6V
The same pulse at 100pS/div, V/div the same as above. Update 2013 Not a great pulse. Better pulser for these tests here: http://www.pa4tim.nl/?p=2677
Just a picture of one of the scopes, the 100MHz Rigol:
I measured the 2445 and 7603:
Rigol: using a Hameg 50 ohm terminator 2.96nS at 11,8Vtt , 118MHz Also tried an extra attenuator but that made allmost no difference. But the square looks a lot better as is.
2445: 1,98nS at 14,5Vtt, 176,76 MHz,
7603: 2,5nS at 12,1Vtt, 140MHz.
You see, now results are more close. But with a better pulse the reall values will be closder to the factory specs.
_________________________
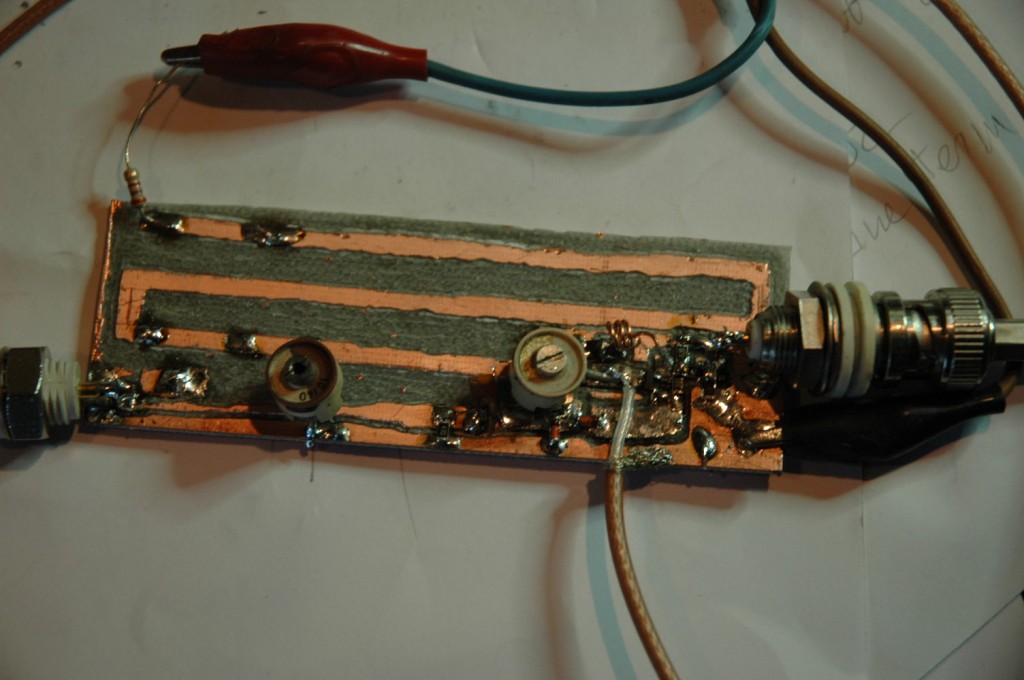
I made a new pulse generator. The design is partly based on that from someone else.
The microstrip chargeline alone is enough but the added coax charge line makes the pulse even wider. This one is 500pS. I even had it at 100pS but the pulswidth (1nS) was to small for slower scopes to trigger.
Edit 2013: Nice leading edge but the roof is not flat enough so results look better as they are.
Some results:
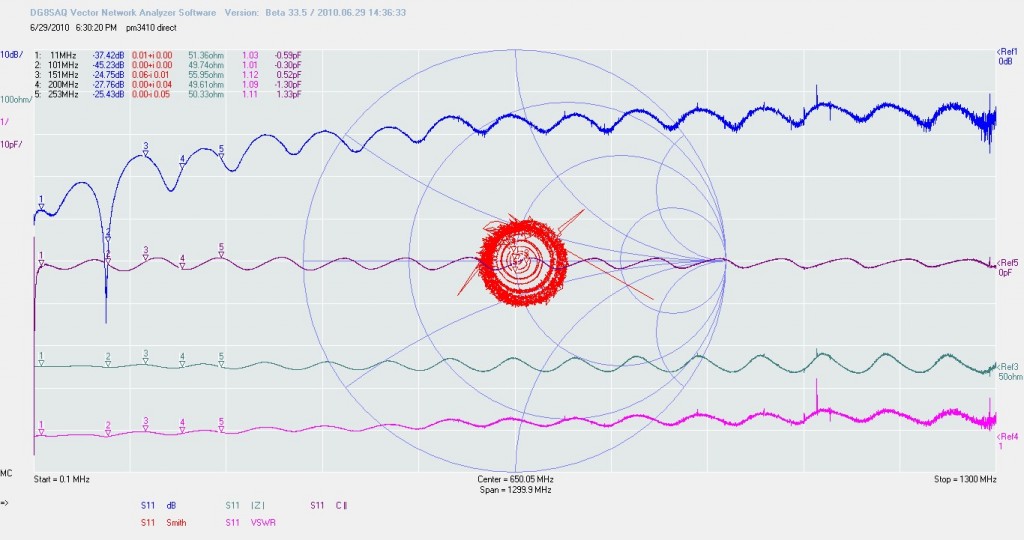
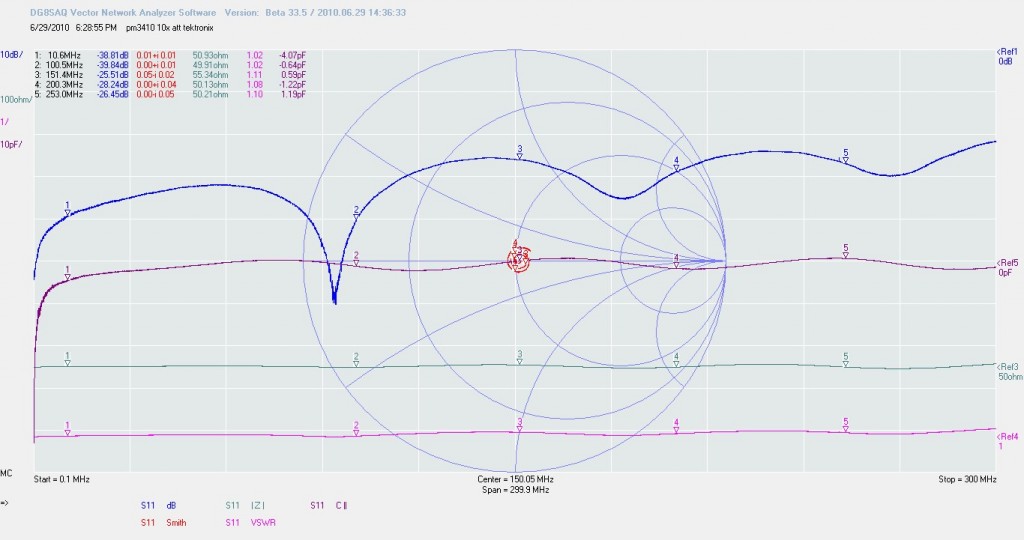
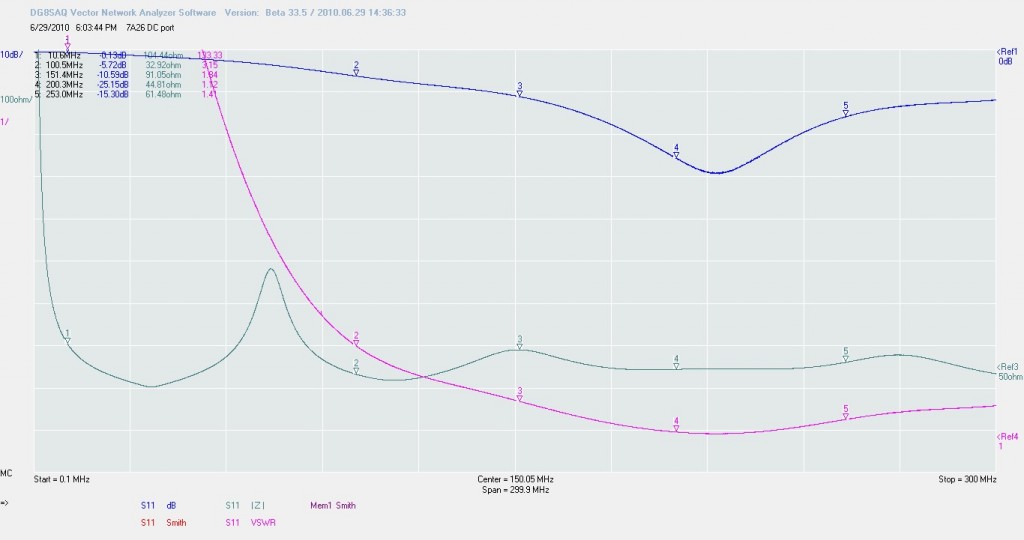
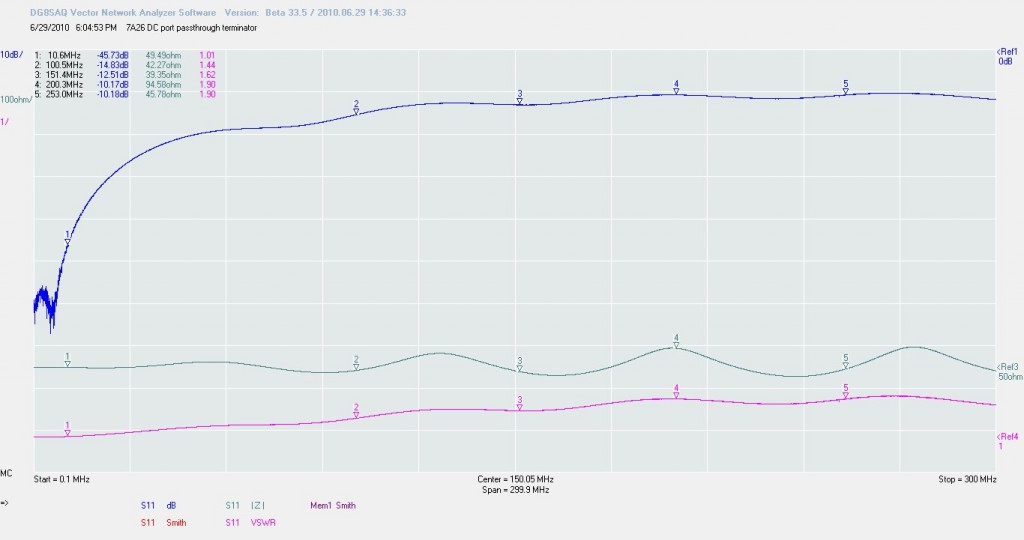
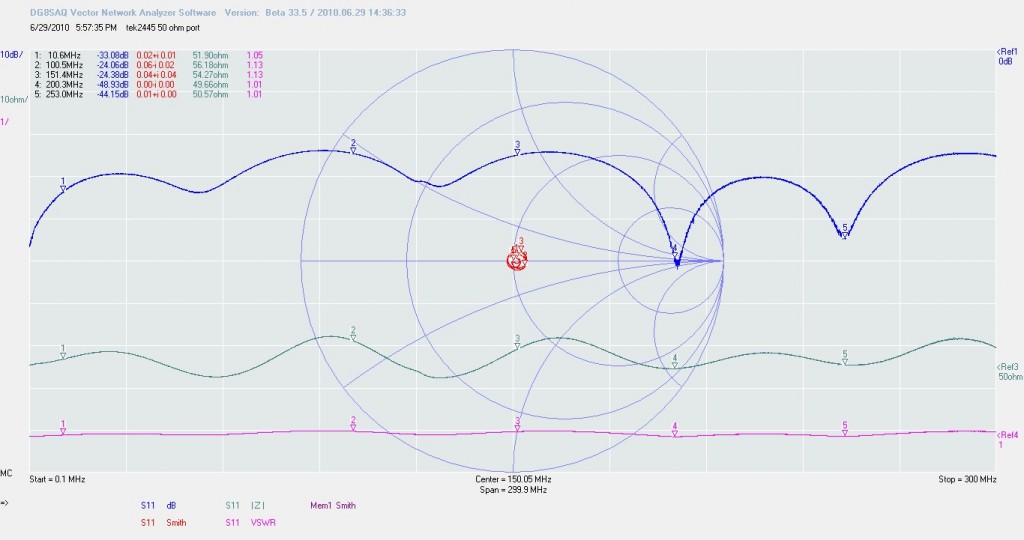
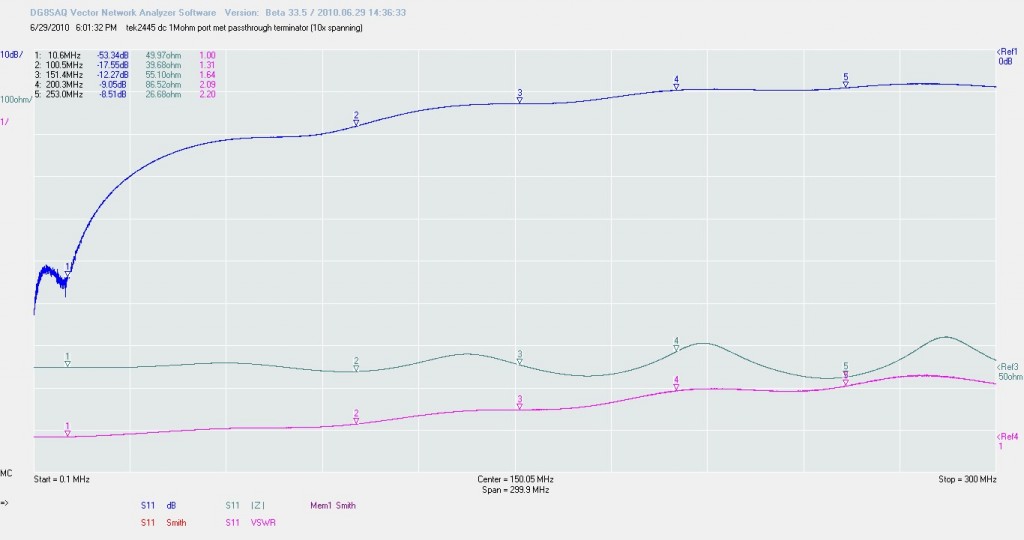
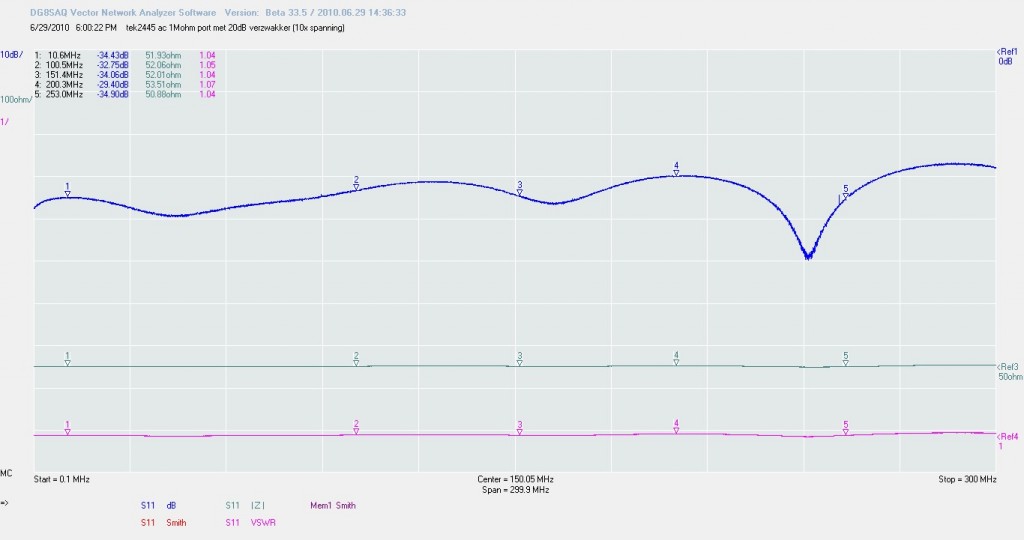
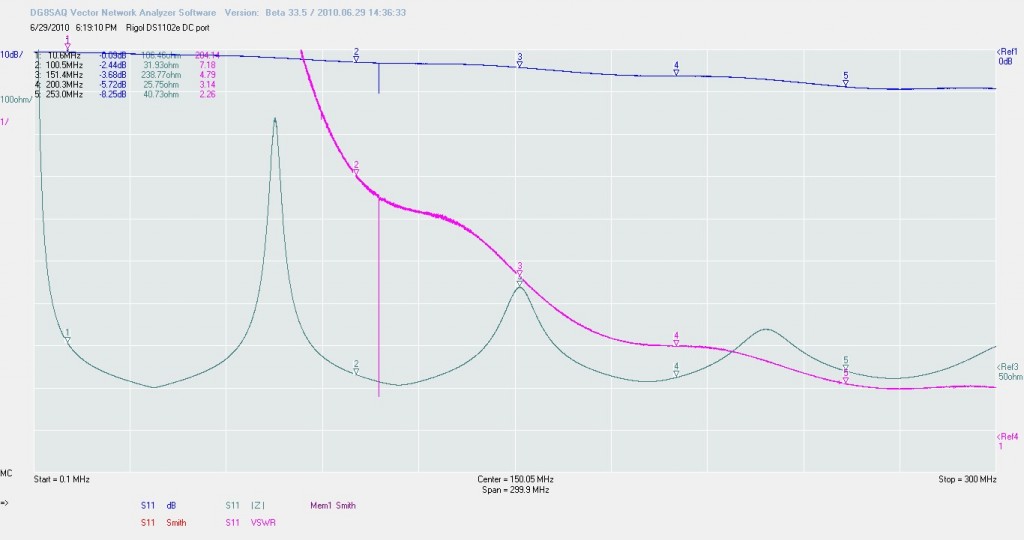
I also measured imput impedance off the scopes

